A Break-Even Analysis Helps Determine the Point at Which Total Revenues Equal Total Costs
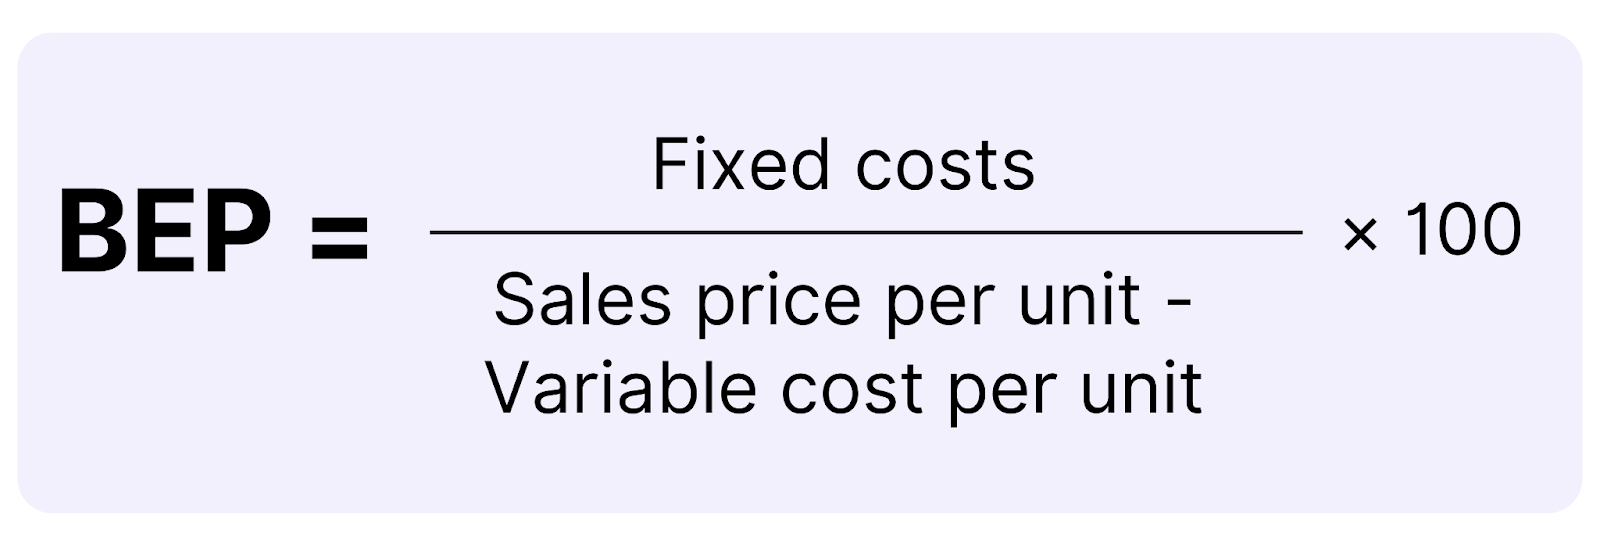
A break-even analysis helps to determine the number of product units that need to be sold for a business to be profitable, knowing the price and the cost of the product. It is crucial to understand the concept of fixed and variable costs to correctly calculate the break-even point during your case interview, but also in your daily work as a consultant. If the fixed costs are greater than zero, then it is important to have a positive contribution margin per unit (i.e. price>variable costs) to reach a break-even point at all.
A break-even analysis helps illustrate the relationship between profits, revenues, and costs
Because of the positive contribution margin, the slope of the revenue line is steeper than the slope of the total costs line. Therefore, revenue per unit is higher than cost per unit. If there were no fixed costs, then obviously the business would be profitable from the beginning. In the example shown above, the costs involved when zero units are sold are the fixed costs only. To cover these fixed costs, the business needs to sell a certain number of units to reach this break-even point or cover the fixed costs.
*article-lock-trigger*
High break-even points usually suggest that a business could benefit from economies of scale
A detailed break-even analysis can provide some insight regarding the economics of a certain project or the entire industry. Imagine you come across a business that has a high break-even point, since the business needs to sell a lot of products to become profitable (e.g., Intel). This scenario is usually due to large fixed costs (so-called asset-heavy industries) which need to be covered by high product sales. In such situations, economies of scale play a major role: The more units you sell, the more you cover the fixed costs. In addition, due to the experience/learning curve, you tend to have fewer variable costs and therefore more control over prices. Also, high fixed costs are a serious entry barrier for new competitors (see Porter's Five Forces for more details).
Apply the break-even analysis in weak profitability situations
For instance, your client is operating at increasing losses even though revenues have increased. You find that the issue is increased costs because of a newly opened factory. The additional fixed costs are still higher than the gain in revenues, leading to losses.
In this case, we can start by hypothesizing the need to increase revenues to fix profitability. In this scenario, it would make sense to check the break-even number of units sold before recommending increased marketing efforts. For a break-even analysis, you need to have information such as fixed costs, variable costs, and price.
Required data
- Yearly fixed costs: $50m
- Average variable cost/product: $1000
- Average price/product: $1500
Calculation
- Profit/product: $1,500 - $1,000 = $500
- Break-even point
- $500 * x units = $50m
- x units = 100,000
As a result, the factory needs to produce and sell 100,000 units. Make sure to check its feasibility and if infeasible, your advice could be to divest the new factory.
Key takeaways
- At the break-even point, a business has no net gain/loss.
- To determine the break-even point, you will need a breakdown of the costs and revenues of the product.
*box-open*Apply the break-even analysis by solving this case: Clothing retailer marketing*box-close*