Schedule mock interviews on the Meeting Board, join the latest community discussions in our Consulting Q&A and find like-minded Interview Partners to connect and practice with!
Back to overview

Bain Company - Business Case Sample

Hi!

I would appreciate if someone could help me with this question. (it's from a Bain sample case)

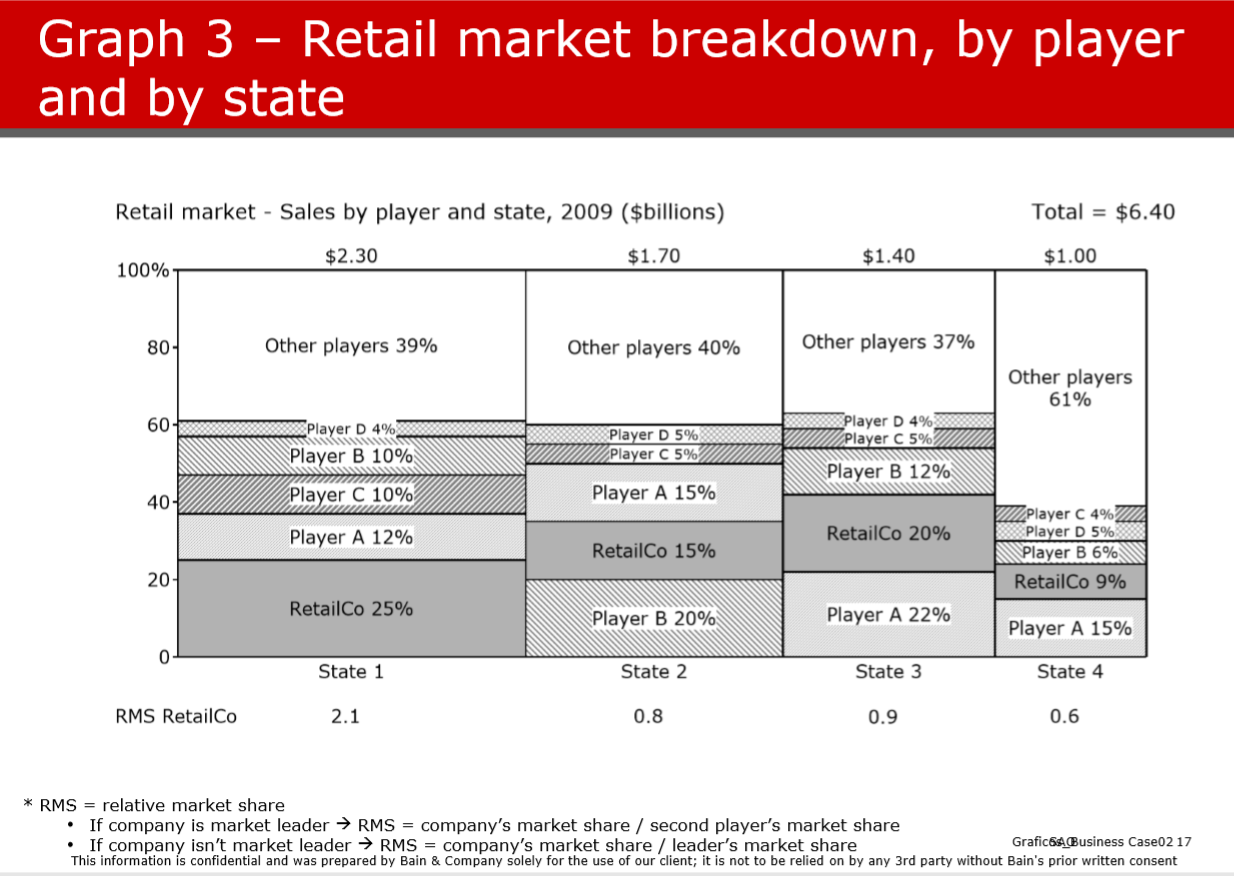
I've attached the chart (which has all the info needed) and the question.

The answer is 1,2 but I can not come up with that number! if anyone could give me a hint..

Thanks!!!Bain & Company Business Case Example

5
9.3k
49
Be the first to answer!
Nobody has responded to this question yet.
Top answer
Jorit
Coach
on Mar 14, 2019
First session -50%| Former BCG | Kellogg MBA | 200+ coaching session| Flexible scheduling

Hi!

The market size of a player in this graph is equal to the area of all its squares. Just by eyeballing it you should be able to say that RetailCo is the market leader and Player A is the number 2. Now you know which formula to use. 

Next you can calculate the actual market size by adding up all the states for each player (share * total sales in the state).

Does this help?

Anonymous B
on Oct 31, 2021
I got a similar question. Could you actually calculate this out and show how you come to the answer? I just did a straight weighted average of sales and that also equals 1.2 so I'm not sure how the formula works...
on Mar 14, 2019

You have four states in which RetailCo is active, and its RMS for each state is given below the mosaic plot (2.1, 0.8, 0.9 and 0.6). You can quickly confirm that these numbers are correct using the provided formula. Now, you need to calculate the overall RMS from the RMS values given for each state. Because the markets of the different states are not of the same size, you cannot calculate a simple average and be done with it, but need to calculate the weighted average, with the size of each of the markets ($2.3, $1.7, $1.4 and $1.0) being the weighting factor and the divisor being the total market size ($6.4). So the calculation you need to do is:

(2.1x2.3 + 0.8x1.7 + 0.9x1.4 + 0.6x1) / 6.4 = 1.26

This gives 1.2 as the closest answer. Hope this is correct and helps you out!

4
on Mar 15, 2019
I don't think I can edit my comment, but want to point out that Jorrit's approach is correct. The approach I described has a logical error - you should look at the whole market first and then calculate the RMS for it. Interestingly, both approached lead to the same answer. This might be by design; however, the value calculated using his approach is significantly closer to 1.2.
Deleted user
edited on Sep 29, 2021

Here's how I solved it:

1) RetailCo's RMS for each state is mentioned directly below the chart, so you shouldn't need to calculate this for each state.

Note: in case you do want to calculate its RMS in each state, just for practice, it is their market share in that state divided by the market share of the single competitor with the largest market share in that state. If Retail Co has the largest market share, then look at the next biggest single competitor and use that competitor's market share for the denominator.

2) Total sales by all players in each state is mentioned directly above the chart.

3) To calculate RetailCo's RMS across the four states, you will have to take their weighted average RMS across the four states. One way you can do this is as follows:

a) Take the sum of the following:

(RetailCo RMS in State 1 * Total Rev of all players in State 1) + (RetailCo RMS in State 2 * Total Rev of all players in State 2) + (RetailCo RMS in State 3 * Total Rev of all players in State 3) + (RetailCo RMS in State 4 * Total Rev of all players  in State 4) 

b) Divide that sum by the total Revenue of all players across the four states

So, it would be as follows: ((2.1*2.3)+(0.8*1.70)+(0.9*1.4)+(.6*1))/(6.40)

This would equal approximately 1.2

1
Vlad
Coach
on Mar 14, 2019
McKinsey / Accenture Alum / Got all BIG3 offers / Harvard Business School

Hi,

  1. Calculate the RMS for each state following the provided rules
  2. Calculate weighted average RMS (% contribution of each state = size of each state  / total (6.4 bn)

Best

on Mar 18, 2019
Doesn't this method give you the wrong answer in case market shares and order of competitors are vastly different across geographies?
on Aug 28, 2019

Do they really expect people to solve this kind of question within very little time and without a calculator? Especially because the answer choices are so close together, it makes it pretty much impossible to estimate by rouding up numbers. 

If someone could please explain me if those are the real expectations of consulting companies I would appreciate. In my opinion this only serves to test if you're a human calculator. 

0
Similar Questions
Consulting
Bain Answer First and Chart Reading Approach
5 hrs ago
Global
4
< 100
Top answer by
Emily
Coach
9 years in MBB Southeast Asia & China| 8 years as MBB interviewer | Free intro call
0
4 Answers
< 100 Views
+1
Consulting
Stating your initial hypothesis
on May 18, 2024
Global
8
1.6k
Top answer by
Pedro
Coach
Bain | EY-Parthenon | Roland Berger | Market Sizing | 30% discount 1st session
50
8 Answers
1.6k Views
+5
Consulting
Can I still get an offer? MBB final round, almost finished one case but didn't.
on Aug 23, 2024
Global
7
1.6k
Top answer by
Pedro
Coach
Bain | EY-Parthenon | Roland Berger | Market Sizing | 30% discount 1st session
58
7 Answers
1.6k Views
+4
How likely are you to recommend us to a friend or fellow student?
0 = Not likely
10 = Very likely
Thanks for your feedback! Your opinion helps us make PrepLounge even better.