
Case Prompt: The beverage department of a regional supermarket has seen a drop in revenue over the last year and has hired your firm to determine the cause of the decline and recommend ways to reverse the trend.
___________
My Clarifying Q's:
1. Can you repeat the client description? I missed whether it was a beverage company or something else?
2. In that case, I understand that the problem we are trying to solve is examining the cause of the decline in revenue for the beverage dept from the past year and see how we can reverse the trend? Is that right?
(Yes)
3. To clarify the problem further, I would like to understand the supermarket's beverage dept's business model and understand how it generates revenue and its customer base?
(Hear response)
4. To clarify further, I would like to understand if there is a metric that we can use to define success, or how success would look like?
(Hear response)
5. Are there are any market trends information, or any additional context you can share?
(Hear response)
Casebook solution:
"Clarifying Information:
• Client is a leading regional grocer within the southeastern U.S.
• Competitive landscape has not changed in the last year
• Revenue decline is specifically within the beverage segment
• Client wants to find the cause of the declining revenue and recommendations for how to stop the decline"
____________
Thanks. In that case, I would like to now pause and take a moment to structure my thoughts on how best we can examine this issue.
(apprx. 2 minutes later)
I'm ready to share my initial approach. My hypothesis is that if the beverage dept has been seeing decline in revenue over the past year, then it is due to either decrease in beverages sales, beverage pricing changes, or from non-financial company actions. And the best way to reverse this trend would lie in any one of these areas or a combination.
To test this hypothesis, my approach is looking at 3 main areas: beverage sales, beverage pricing, and non-financial company actions.
In beverage sales, I would like to examine 1. the # of drinks sold before and after the decline, 2. what kind of drinks/products declined in popularity and why, or whether it is the entire beverage portfolio, and 3. the beverage sales variation among the supermarket's SE stores.
In beverage pricing, I would like to examine 1. the $ price per beverage type, 2. any changes in pricing before and after decline, and 3. by how much it has varied by?
In non-financial company actions, I would like to examine 1. any changes in product placement, 2. any changes in beverage manufacturer suppliers, 3. how the quality of beverage products has been before and after such as in defects, and 4. the volume of customer complaints regarding the beverage products before and after the revenue decline.
If you do not think we should add anything else to this approach, then I would like to begin with examining any available data on beverages sales and beverage pricing first ahead of non-financial company actions.
(Is my framework great and MECE???)
_____
Casebook framework solution:
A Good Framework Will:
o Focus on revenue and its levers of price and quantity, staying away from costs
o Contain creative recommended options for brainstorming discussion to reverse the revenue decline trend
o Incorporate knowledge of existing marketing frameworks such as the 4P’s Necessary Information that should be given only when specifically asked for by interviewee:
o Exhibit 1
▪ Provide when interviewee asks specifically for revenue / sales numbers segmented by beverage product category
o Exhibit 2
▪ Provide after interviewee determines revenues are only declining in sodas and asks for further segmented information by brand
__________
Exhibit 1:
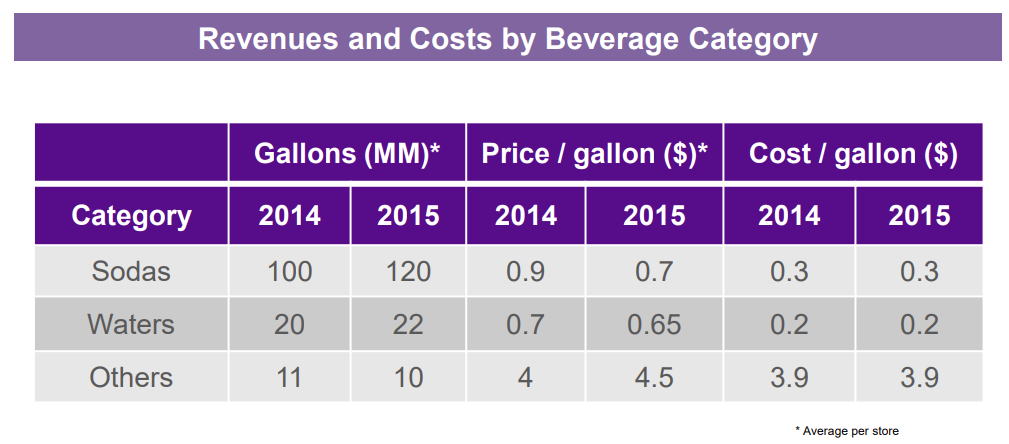
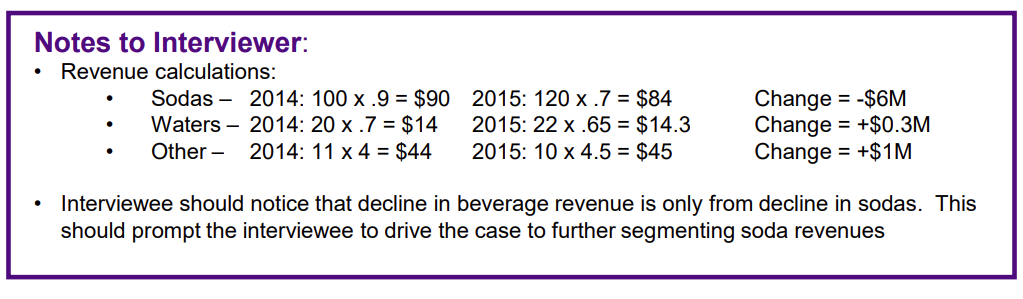
Exhibit 2:
My Exhibit 1 Approach:
Thanks. I'll take a quick pause. (apprx. 30 seconds, reading the title, axes, and information)
I see that this chart shows the sales per beverage type in gallons sold and the price point it was being sold at, before and after the revenue decline.
For the sodas, I see that their of sales increased from 2014 to 2015, For the waters, they also increased, but to a lower extent than sodas. For the other beverage types, they decreased slightly by around only 1 gallon.
(I pause and write this down)
For the price per gallon, I see that the sodas pricing decreased, the waters pricing decreased slightly, and the others pricing increased slightly.
( I pause and write this down)
It seems that of all beverage types, sodas would have the most significant change in revenue due to the highest change in quantity sold and their pricing.
It would be great to take a moment to calculate each beverage type's revenue change from the years.
(Interviewer agreement)
My approach would be to calculate the revenue per bev type by multiplying quantity sold by the price per year. And then subtract the revenue amount from 2015 and 2014 for each bev type. This will help me see which segment has changed the most in revenue over the year, such as sodas. If this approach sounds good, I can begin with the calculations.
(Interview agrees approach)
For sodas, in 2014, 100 gallons were sold at $0.90 (ninety cents). Hence, the revenue is 100 times 0.90, which is (I pause and jot this down. apprx. 10-20 seconds later): $90 dollars
For sodas, in 2015, 120 gallons were sold at $0.7 (seventy cents). Hence, the revenue is 120 times 0.7, which is (I pause and jot this down, apprx. 10-20 seconds later): $84 dollars
Hence, the change in revenue from sodas over the past year has been a $6 drop in revenue.
(Now I do the same thing with waters, and others)
I see now that the decline in bev. revenue among all bev types is only from the decline in soda revenue. It would be great to further segment the sodas by brand to further understand where the decline in revenue is coming from.
_______________
My Exhibit 2 Approach:
Thanks. I'll take a quick pause. (apprx. 30 seconds, reading the title, axes, and information)
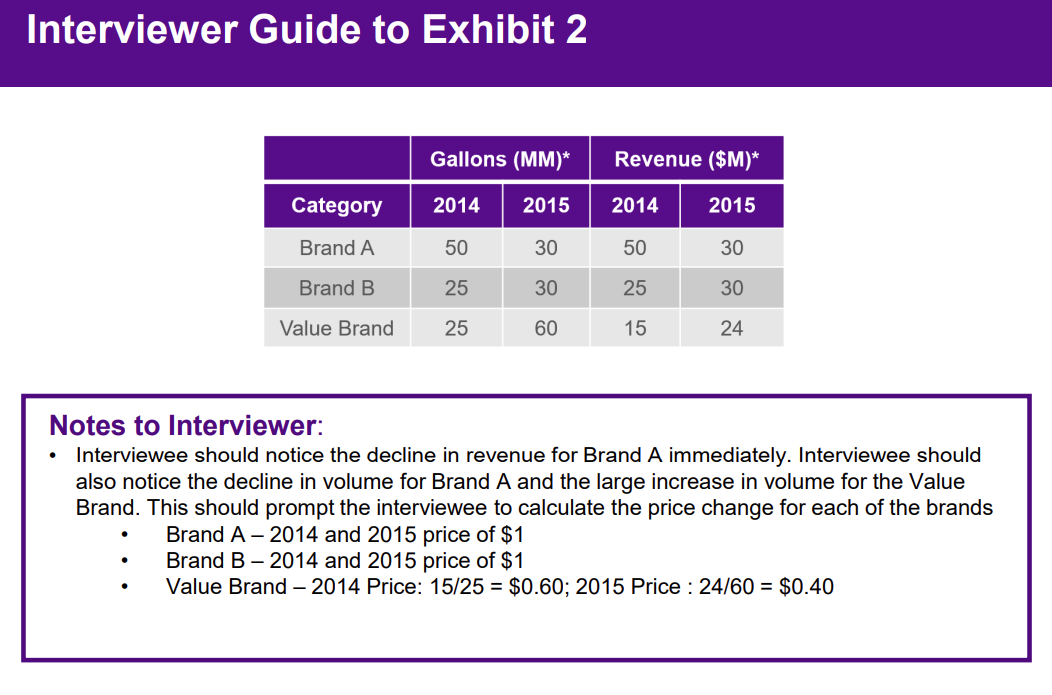
I see that this chart shows there there are 3 types of soda brands, and their number of sales and revenue before and after the decline.
For Brand A, I see that the quantity sold and its revenue has declined sharply from 2014 and 2015. And for Brand B, I see that it has increased slightly in quantity sold and revenue generated. And for the Value Brand, I see that the Value Brand has increased apprx double the amount sold in 2014 and increased its revenue. (I pause and jot this down)
Given this, it would be great to take a moment to calculate each soda brand's price change from these years to better understand how the pricing of these brands is affecting their respective revenue.
(Interviewer agreement)
My approach to obtain the price changes is by first dividing revenue by the quantity sold for each soda brand in each year. Then subtract the price from both years for each soda brand to get the price change.
(Interviewer agreement)
For Brand A in 2014, I see that the revenue was $50M (50 million dollars) and 50M gallons (50 million gallons).
(I pause and jot this down)
Hence, the price per gallon was $1. It was also $1 in 2015, hence no price change for Brand A.
(I pause and jot this down)
For Brand B in 2014, I see that etc, etc, etc. Also $1, hence no price change for Brand B.
(I pause and jot this down)
For the Value Brand in 2014, I see that the revenue was $15M (15 million dollars) and the quantity sold was 25M gallons.
(I pause and jot this down)
Hence, the price per gallon in 2014 was ... (pause and jot down, apprx 10-20 seconds later).. $0.60 (60 cents per gallon).
For the value brand in 2015, I see, etc, etc.... $0.40 (40 cents per gallon). Hence, the price change is $0.20 (20 cents per gallon), almost a 33% decrease in pricing.
I see now that the decline in bev. revenue among all bev types can be attributed to the price change coming from the Value Brand. Do we have any additional data that can shed further light on this revenue decline?
(Interviewer would say no and ask what kind of data I would further like and why. Would say that I can go straight to the recommendations now)
________________________________
Casebook recommendation solution:
The client would like to hear your recommendations for how to reverse the decline in revenue of the beverage segment.
Notes to Interviewer: A great candidate will not need prompting of this question, and will drive the case forward remembering that recommendations for reversing the declining revenue were a part of the prompt • Upon determining that the value brand is causing the overall decline in the beverage segment, a great candidate will move the case forward with recommendations
Objective for the interviewee would to be able to provide a number of recommendations and stay structured while doing so
• Possible option would be to organize brainstorming recommendations around 4P’s • Price • Promotion • Product • Placement
Recommendation:
• Adjust price of Value Brand
• Improve differentiation from Brand A and Value Brand
Risks:
• Alienating value brand customers with price change
• Alienating suppliers of Brand A or B with any price changes of those brands
Next Steps:
• Explore pricing strategies for value brand
• Explore bundling opportunities to increase sales of other brands
• Explore marketing activities to differentiate value brand from brands A and B
• Explore shelf placement of value brand vs brands A and B D
Bonus: Guide to an excellent case
• In an excellent case, the interviewee will efficiently drive the case, taking insights from each exhibit and moving the case forward with no prompting of the interviewer
_________________________________________
My Recommendation:
Given that the beverage dept of the regional supermarket has been observing declines in Revenue over the past year, I recommend increasing the price per gallon for the Value Brand sodas by 33% to get back to the original 2014 pricing of $0.60 per gallon (60 cents per gallon).
One reason for this recommendation is because we found that of all beverages, sodas had the sharpest decline in Revenue, of which the Value Brand sodas underwent the pricing decrease.
Another reason for this recommendation is that implementing this price change can also requires a lower number of customers to purchase in terms of quantity sold, meaning that the revenue generated going forward can go back to original levels with lower supply sold and higher price, using principles of supply and demand.
With this recommendation, there are some risks. One is that there could be customer hesitation in buying value brand sodas given regular customers would notice the price increase. The second is that the suppliers of value brand sodas may not appreciate having to supply lower number of value brand sodas for the supermarket to stock their shelves with.
To address these risks, we can continue our work and collaborate on ways to maximize customer purchases even with the price increase of value brand sodas by marketing its product better to differentiate it from the other soda brands as a cost-effective buy, and we can also work on strategies to explore how best to minimally strain the supplier relationship for value brand sodas should we need to purchase less of them for stocking at any given point.
Thank you.
___________________DONE____________________________


i. Your 3 possibilities are not at the same level. So this is an issue with structuring. Your options 1. and 2. address decrease in revenue, your option 3. addresses potential explanations for that decrease. So you may have a decrease in unit sales AND and increase in complaints. Conceptually these should be separated in your structure. In other words, branch 1 and 2 should IDENTIFY what is happening, branch 3 WHY it is happening.
ii. You are completely ignoring demand and competition. This is a major flaw in your structure. You cannot go and look for internal reasons without isolating first that this is a problem specific to your client.